The stocks market has been on correction course since January of 2022. Falling from its all time high to recovering 20% off of its lows. Plenty of opportunities allowed investors to get into the market and get nice returns. No, I'm not talking about index funds, mutual funds, or ETFs. I'm talking about single stocks. Wall Street products that were created for the average investor is what is pushed on the public. While I do believe it's fine if you choose to park your saving in these types of funds. It's not hard to do your own research on if a company is a good company to place your capital in their stock. Going back years when you had to order products to get a companies earning numbers, you had to wait to get them by mail. Now you just go online to look to see what a company has done. Yet, you see ads on the major financial channels pushing investment funds. Now there are the Jim Cramer's of the world who speaks about individual stocks but it wouldn't be wise to listen to any of them without doing research yourself. In this article I'm going to explain why single stocks are not recommended, what you can do as a individual investor, and how to proceed forward if you want to invest in individual stocks.
Why are Single Stocks not Recommended?
There are three main reasons why single stocks are not recommended to the public because, first, most people have no idea how to do a valuation on a stock. Just like myself when I got started I had no idea how to look into a company's earnings to see how much they were growing or contracting. I didn't know the company's management and what their plans were to keep the business profitable. This is where having knowledge and facts can help you determine if you are in the right investment or not. The second reason is because there are many financial advisors and gurus who recommend you do not put single stocks in your portfolio. These advisors and gurus recommend mutual funds, index funds, and ETFs. This is a big business for the financial industry and these companies and individuals need to use investors' funds to keep their business in business. The third reason I believe is because many people are passive investors and would rather have an expert manage their portfolio or retirement funds for them. While this is not a bad thing to do if you feel you don't have the time to research. However, I've seen many investors get hurt turning their money over to an expert. Back in the 2008 correction we saw mutual funds lose just as much and sometimes more than the overall markets. Here recently had you invested before the 2022 top your funds would have been down also.
What can regular investors do?
First thing to do is educate yourself and learn the fundamentals of evaluating a stock. Ask yourself these questions. Can you look at a companies income statement and balance sheet and understand their financial strength or weakness. Do you know the language or terms used like Earning Per Share (EPS), Price/Earnings Ratio (PE), and revenue? If not I'll provide the definitions of these terms in this article as I explain how I evaluate a stock. This way of investing has been around for well over 100 years but most of the money in retirement accounts are in funds. No one really questions why or why not when they start putting money away for retirement, should they invest in funds or with a good company that has solid growth. Warren Buffet has invested in single stocks his entire investing career but you will hear "well you are not Warren Buffet and you don't have billions of dollars". While you don't have billions of dollars you can put your money and use the strategy laid out in this article and get better returns than just putting in a fund that follows the market.
Evaluate Growth
When I'm evaluating growth I'm looking for a company that can grow in certain areas where the growth can help determine the value of the stock. Later in this article I'll give more details on how to measure growth so you can do it yourself. These concepts come from the book Rule #1 by Phil Town. Before just picking a random company and running these numbers read the book because he goes into detail of a company having the four M's which are Meaning, Moat, Management, and Margin of Safety. In this article I'll only cover Margin of Safety because that is the price we are going to determine the price we pay for the stock and I want to be as brief as possible.
- Revenue
- Earnings per share (EPS)
- Return on Invested Capital (ROIC)
- Book value per share (BVPS)
- Free cash flow (FCF)
Let's start with Revenue and its basic definition and how I evaluate it. Revenue is the total amount of money a company took in from selling its products and services. It's that simple and some people complicate it. However, I can't discuss revenue without providing you a basic definition of Earnings. Earnings is simply a company's revenue minus their expenses. A company with consistent growing revenue shows their products are in demand. I like to measure this number and the other ones going back over the last ten years to see if it's growing at 10% or better.
Earnings per share (EPS) EPS is the Earnings divided by total shares outstanding. The higher the EPS the more profitable the company is considered to be. You may be asking yourself what shares outstanding? Shares outstanding is all of the shares issued by a company that investors own. These shares can be bought and sold on the open market if the shareholders want to buy or sell. As I mentioned before I like to see this number growing also.
Return on Invested Capital (ROIC) Return on Invested Capital is the rate of return on the cash it invests on itself every year. ROIC is the number that can be used to tell you if a company is being run well or run badly. The number should be equal to or greater than 10% per year, but the real key is seeing if the ROIC number is going up over time. When looking at this number it is given in percentages so I just take the average it has done over the period of time that I'm measuring.
Book Value per share - BVPS is what you would have if you sold everything off and paid off your debts and took what is left. This can be summed up as the total equity per share of the company. If this number is growing it shows that the company is growing in value.
Free cash flow - A company's free cash flow lets the investor know if the company's cash is aligned with their profits. The company's cash growth tells us whether their cash is growing with their profits or if the profits are just on paper. As an investor you want real cash growth and not paper profits.
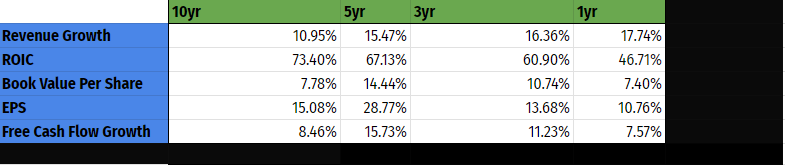
What I like to see is that these numbers are at 10% or above over the last ten years. As presented in the book I look at the 1yr, 3yr, 5yr, and 10yr growth rates. To get numbers on a company going back for ten years you can go to a website called
Stockrow. Go to the website and put in the company you want to see and set it to their annual numbers. At the end of the article I'll share my free ebook on how I put these numbers in a google sheet. Below are the formulas for measuring once you get the numbers from Stockrow.
Below is an example of the data pulled for Microsoft from stockrow so I can begin my analysis using the functions in google sheets.
To measure the 10yr growth I use the Rate function below. I also like to see the 5yr, 3yr, and 1yr.
- = Rate(9,,-number from 10 year ago, current year number)
- = Rate(5,,-number from 5 year ago, current year number)
- = Rate(3,,-number from 3 year ago, current year number)
- = Rate(1,,-number from 1 year ago, current year number)
You will notice I used a 9 instead of a 10 when comparing the number from 10 years ago. That is because you are measuring it from its current years number and you only have 9 years of data before the current years number. On the 5yr, 3yr, and 1yr you don't have to do that. My ebook has more details but I just wanted to share how I use the Rate function in google sheets. This also works the same in an Excel spreadsheet. Notice I have a minus sign in front of the number from ten years ago. Note to use that so the function can return you the correct number. Also the double comma is because you are not using some of the parameters built into the rate function. You are only using the parameters you need.
Below is an example of the data displayed on the 1yr, 5yr, 3yr, and 10yr. Take a look at the numbers and you will notice a few are below 10% with this example. As long as they are not severely below you can still invest. Overall I like the growth in Microsoft over the last ten years and would consider buying.
Intrinsic Value
Now there are many different ways you can get a stock's intrinsic value and the two that come to mind is the one developed by Ben Graham back in the 1940s that was shared in his book The Intelligent Investor. I'll write a article at another date on how I calculate using his formula but for now let's finish with Rule #1. The second one I use that was shared by Phil Town in his book Rule #1. While both methods are great for finding a stock's intrinsic value I lean towards the one laid out in rule one. Now that you have the growth numbers there are a few other things you need to find the intrinsic value.
- Trailing 12 month EPS
- Trailing 12 month P/E ratio
- Minimum rate of return of 15%
Before we begin I want to just give you a basic definition of the P/E ratio. Price to earnings ratio, or P/E, is a way to value a company by comparing the price of a stock to its earnings. The P/E equals the price of a share of stock, divided by the company's earnings per share. It tells you how much you are paying for each dollar of earnings.
You can find these numbers on Yahoo Finance or MSN along with Stockrow also. Next we need to take these numbers and determine the 10yr future price using the Future Value function. What we will do next is take our current EPS and get a future value with 15% growth and multiply it by the current P/E ratio.
- =FV(15%, 10,,-Current EPS)
- Forward EPS * Current P/E = 10 yr future price
Next we need to determine our intrinsic value. To get our intrinsic value or what Phil calls in the book the "Sticker Price" we then use the Present Value function on the 10 yr future price to get today's current intrinsic value/sticker price.
- =PV(15%,10,,-10yr future price)
In the next section you will see the output of the 10yr future price and the intrinsic value.
As noted before make sure you put the minus sign in its correct place in the function. The future value and present value work the same as the rate function but the minus sign is in different places. Also keep in mind that you are using the parameters you need.
Margin of Safety
If you have ever listened to Warren Buffet you have heard him speak about having a margin of safety when investing in securities. What he means is buying a great company at a discounted prices well below it's intrinsic value. You know the fair price of the company you just researched and you see it at 50%-70% off.
So now you might be wondering how do you get the margin of safety price now that you have the stocks intrinsic value. In the book Rule #1 by Phil Town its really simple. Just take your intrinsic value and divide it by two and that becomes your margin of safety price. This is the price we want to buy the stock. See the Microsoft example below I want you to notice the Sticker Price is $337.26. As of this writing Microsoft is trading at 337.22. The price we want to buy it at is $168.63 or $169.00 roughly. Let's say you hold this stock for ten years and you are in at average price of $169.00 and you invested $10,000 which is roughly 60 shares. If Microsoft does as predicted your 60 shares in the future are worth $81,840 at the 10 yr future price.

This a lot to absorb in one article, so I suggest you do some follow on studying and give this article a second read. Start with the book
Rule #1. I've also awhile back put together a ebook that I published and give away for free on how to put these numbers in a google sheet. I share it in my
Foundational Understanding of Investing and Trading ebook. Just read module 2. Thanks for reading.
Happy Investing.


Comments
Post a Comment